Latham’s Snipe
Gallinago hardwickii
ABR description
The following is extracted from the Annual Bird Report for the twelve months to June 2017.
Common, non-breeding summer migrant
General: An increase in virtually all indices from last year (number of records, distribution, abundance (0.13 cf 0.08 last year) and reporting rate (3.2% cf 2.3% last year). Reported between 15 Aug and 13 Mar from 33 sites. Max 49/21 Jan Wet Lagoon, Breadalbane GrS02 (AnF1). 20 or more birds also recorded on at least one occasion from JWNR, Forde Pond-Horse Park Drive Wetland GrL11, Rose Lagoon GrU04 and Collector Reserve GrS04. The increase may be due to the Snipe survey conducted by the Woodlands and Wetlands Trust (see Davey, C & Gould, L, 2017).
GBS: 9 records from the same 3 sites as last year, Giralang (McD4, KaD1) and Yarralumla (NeG1). Recorded between 3wk Oct and 3wk Feb, all single birds apart from 2/3wk Jan Giralang (McD4).

Abundance
Abundance is the average number of birds of that species per survey. Where the species was observed (presence recorded) but the number of birds seen was not recorded, this is treated as a count of zero.
Abundance by year
This chart shows the abundance of Latham’s Snipe between 1982 and 2017. 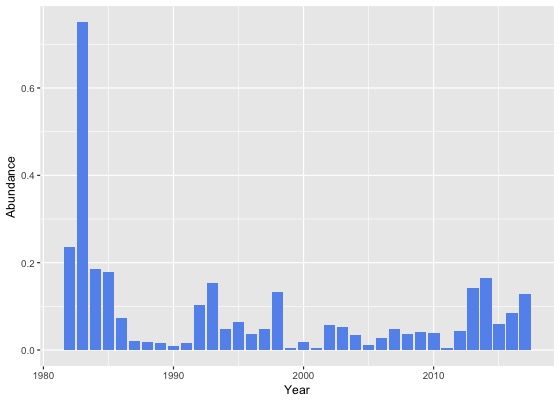
Abundance by month
This chart shows the monthly abundance of Latham’s Snipe. The blue lines show the abundance for the twelve months to June 2017 and the bars show the average abundance for the period 1982 to 2017. 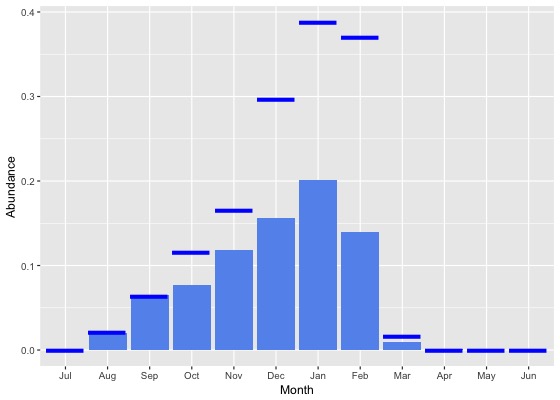
Abundance by season
This chart shows the seasonal abundance of Latham’s Snipe. The blue lines show the seasonal abundance for the twelve months to June 2017 and the bars show the average seasonal abundance for the period 1982 to 2017. 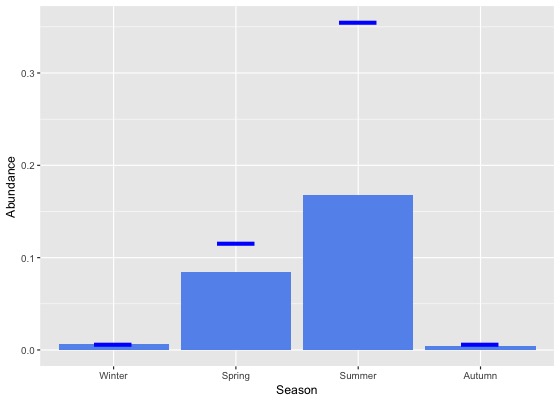
Abundance data
| Month | Season | ||||||||||||||||||
|---|---|---|---|---|---|---|---|---|---|---|---|---|---|---|---|---|---|---|---|
| Period | Jul | Aug | Sep | Oct | Nov | Dec | Jan | Feb | Mar | Apr | May | Jun | Winter | Spring | Summer | Autumn | All | ||
| All years | |||||||||||||||||||
| All | 0.0 | 0.0 | 0.1 | 0.1 | 0.1 | 0.2 | 0.2 | 0.1 | 0.0 | 0.0 | 0.0 | 0.0 | 0.0 | 0.1 | 0.2 | 0.0 | 0.1 | ||
| Previous years | |||||||||||||||||||
| All previous years | 0.0 | 0.0 | 0.1 | 0.1 | 0.1 | 0.1 | 0.2 | 0.1 | 0.0 | 0.0 | 0.0 | 0.0 | 0.0 | 0.1 | 0.1 | 0.0 | 0.1 | ||
| Previous 30 years | 0.0 | 0.0 | 0.1 | 0.1 | 0.1 | 0.1 | 0.2 | 0.1 | 0.0 | 0.0 | 0.0 | 0.0 | 0.0 | 0.1 | 0.1 | 0.0 | 0.1 | ||
| Previous 20 years | 0.0 | 0.0 | 0.1 | 0.1 | 0.1 | 0.1 | 0.2 | 0.1 | 0.0 | 0.0 | 0.0 | 0.0 | 0.0 | 0.1 | 0.1 | 0.0 | 0.1 | ||
| 10 year groups | |||||||||||||||||||
| [2007,2017) | 0.0 | 0.0 | 0.1 | 0.1 | 0.2 | 0.2 | 0.2 | 0.1 | 0.0 | 0.0 | 0.0 | 0.0 | 0.0 | 0.1 | 0.2 | 0.0 | 0.1 | ||
| [1997,2007) | 0.0 | 0.0 | 0.0 | 0.0 | 0.0 | 0.1 | 0.1 | 0.0 | 0.0 | 0.0 | 0.0 | 0.0 | 0.0 | 0.0 | 0.1 | 0.0 | 0.0 | ||
| [1987,1997) | 0.0 | 0.0 | 0.1 | 0.1 | 0.1 | 0.1 | 0.1 | 0.1 | 0.0 | 0.0 | 0.0 | 0.0 | 0.0 | 0.1 | 0.1 | 0.0 | 0.0 | ||
| 5 year groups | |||||||||||||||||||
| [2012,2017) | 0.0 | 0.0 | 0.1 | 0.1 | 0.2 | 0.2 | 0.2 | 0.1 | 0.0 | 0.0 | 0.0 | 0.0 | 0.0 | 0.1 | 0.2 | 0.0 | 0.1 | ||
| [2007,2012) | 0.0 | 0.0 | 0.0 | 0.1 | 0.1 | 0.0 | 0.1 | 0.0 | 0.0 | 0.0 | 0.0 | 0.0 | 0.0 | 0.1 | 0.1 | 0.0 | 0.0 | ||
| [2002,2007) | 0.0 | 0.0 | 0.0 | 0.0 | 0.0 | 0.1 | 0.2 | 0.0 | 0.0 | 0.0 | 0.0 | 0.0 | 0.0 | 0.0 | 0.1 | 0.0 | 0.0 | ||
| [1997,2002) | 0.0 | 0.0 | 0.1 | 0.0 | 0.0 | 0.0 | 0.0 | 0.0 | 0.0 | 0.0 | 0.0 | 0.0 | 0.0 | 0.0 | 0.0 | 0.0 | 0.0 | ||
| [1992,1997) | 0.0 | 0.0 | 0.2 | 0.1 | 0.1 | 0.0 | 0.2 | 0.1 | 0.0 | 0.0 | 0.0 | 0.0 | 0.0 | 0.1 | 0.1 | 0.0 | 0.1 | ||
| [1987,1992) | 0.0 | 0.0 | 0.0 | 0.0 | 0.0 | 0.1 | 0.0 | 0.1 | 0.0 | 0.0 | 0.0 | 0.0 | 0.0 | 0.0 | 0.0 | 0.0 | 0.0 | ||
| Year | |||||||||||||||||||
| 2017 | 0.0 | 0.0 | 0.1 | 0.1 | 0.2 | 0.3 | 0.4 | 0.4 | 0.0 | 0.0 | 0.0 | 0.0 | 0.0 | 0.1 | 0.4 | 0.0 | 0.1 | ||
| 2016 | 0.0 | 0.1 | 0.1 | 0.2 | 0.2 | 0.2 | 0.1 | 0.1 | 0.0 | 0.0 | 0.0 | 0.0 | 0.0 | 0.2 | 0.1 | 0.0 | 0.1 | ||
| 2015 | 0.0 | 0.0 | 0.1 | 0.1 | 0.2 | 0.1 | 0.1 | 0.1 | 0.0 | 0.0 | 0.0 | 0.0 | 0.0 | 0.1 | 0.1 | 0.0 | 0.1 | ||
| 2014 | 0.0 | 0.0 | 0.1 | 0.1 | 0.2 | 0.6 | 0.5 | 0.3 | 0.0 | 0.0 | 0.0 | 0.0 | 0.0 | 0.1 | 0.5 | 0.0 | 0.2 | ||
| 2013 | 0.0 | 0.0 | 0.0 | 0.1 | 0.3 | 0.4 | 0.4 | 0.1 | 0.0 | 0.0 | 0.0 | 0.0 | 0.0 | 0.1 | 0.3 | 0.0 | 0.1 | ||
| 2012 | 0.0 | 0.0 | 0.1 | 0.0 | 0.1 | 0.1 | 0.1 | 0.1 | 0.0 | 0.0 | 0.0 | 0.0 | 0.0 | 0.1 | 0.1 | 0.0 | 0.0 | ||
| 2011 | 0.0 | 0.0 | 0.0 | 0.0 | 0.0 | 0.0 | 0.0 | 0.0 | 0.0 | 0.0 | 0.0 | 0.0 | 0.0 | 0.0 | 0.0 | 0.0 | 0.0 | ||
| 2010 | 0.0 | 0.0 | 0.1 | 0.0 | 0.1 | 0.1 | 0.0 | 0.0 | 0.0 | 0.0 | 0.0 | 0.0 | 0.0 | 0.1 | 0.1 | 0.0 | 0.0 | ||
| 2009 | 0.0 | 0.1 | 0.0 | 0.1 | 0.1 | 0.0 | 0.1 | 0.0 | 0.0 | 0.0 | 0.0 | 0.0 | 0.0 | 0.1 | 0.1 | 0.0 | 0.0 | ||
| 2008 | 0.0 | 0.0 | 0.0 | 0.1 | 0.1 | 0.0 | 0.3 | 0.0 | 0.0 | 0.0 | 0.0 | 0.0 | 0.0 | 0.1 | 0.1 | 0.0 | 0.0 | ||
| 2007 | 0.0 | 0.0 | 0.0 | 0.1 | 0.2 | 0.1 | 0.1 | 0.1 | 0.0 | 0.0 | 0.0 | 0.0 | 0.0 | 0.1 | 0.1 | 0.0 | 0.0 | ||
| 2006 | 0.0 | 0.0 | 0.0 | 0.0 | 0.0 | 0.0 | 0.2 | 0.1 | 0.0 | 0.0 | 0.0 | 0.0 | 0.0 | 0.0 | 0.1 | 0.0 | 0.0 | ||
| 2005 | 0.0 | 0.0 | 0.0 | 0.0 | 0.0 | 0.0 | 0.1 | 0.0 | 0.0 | 0.0 | 0.0 | 0.0 | 0.0 | 0.0 | 0.0 | 0.0 | 0.0 | ||
| 2004 | 0.0 | 0.0 | 0.1 | 0.1 | 0.0 | 0.0 | 0.2 | 0.0 | 0.0 | 0.0 | 0.0 | 0.0 | 0.0 | 0.1 | 0.1 | 0.0 | 0.0 | ||
| 2003 | 0.0 | 0.0 | 0.0 | 0.1 | 0.2 | 0.1 | 0.2 | 0.0 | 0.0 | 0.0 | 0.0 | 0.0 | 0.0 | 0.1 | 0.1 | 0.0 | 0.1 | ||
| 2002 | 0.0 | 0.0 | 0.0 | 0.0 | 0.0 | 0.2 | 0.4 | 0.0 | 0.0 | 0.0 | 0.0 | 0.0 | 0.0 | 0.0 | 0.2 | 0.0 | 0.1 | ||
| 2001 | 0.0 | 0.0 | 0.0 | 0.0 | 0.0 | 0.0 | 0.0 | 0.0 | 0.0 | 0.0 | 0.0 | 0.0 | 0.0 | 0.0 | 0.0 | 0.0 | 0.0 | ||
| 2000 | 0.0 | 0.0 | 0.0 | 0.0 | 0.1 | 0.0 | 0.0 | 0.0 | 0.0 | 0.0 | 0.0 | 0.0 | 0.0 | 0.0 | 0.0 | 0.0 | 0.0 | ||
| 1999 | 0.0 | 0.0 | 0.0 | 0.0 | 0.0 | 0.0 | 0.0 | 0.0 | 0.0 | 0.0 | 0.0 | 0.0 | 0.0 | 0.0 | 0.0 | 0.0 | 0.0 | ||
| 1998 | 0.0 | 0.0 | 0.6 | 0.0 | 0.0 | 0.3 | 0.1 | 0.0 | 0.0 | 0.0 | 0.0 | 0.0 | 0.0 | 0.2 | 0.2 | 0.0 | 0.1 | ||
| 1997 | 0.0 | 0.0 | 0.0 | 0.0 | 0.1 | 0.0 | 0.2 | 0.4 | 0.0 | 0.0 | 0.0 | 0.0 | 0.0 | 0.0 | 0.2 | 0.0 | 0.0 | ||
| 1996 | 0.0 | 0.0 | 0.3 | 0.1 | 0.1 | 0.0 | 0.0 | 0.0 | 0.0 | 0.0 | 0.0 | 0.0 | 0.0 | 0.1 | 0.0 | 0.0 | 0.0 | ||
| 1995 | 0.0 | 0.1 | 0.0 | 0.0 | 0.3 | 0.2 | 0.1 | 0.0 | 0.0 | 0.0 | 0.0 | 0.0 | 0.0 | 0.1 | 0.1 | 0.0 | 0.1 | ||
| 1994 | 0.0 | 0.0 | 0.0 | 0.0 | 0.0 | 0.0 | 0.2 | 0.4 | 0.0 | 0.0 | 0.0 | 0.0 | 0.0 | 0.0 | 0.2 | 0.0 | 0.0 | ||
| 1993 | 0.0 | 0.0 | 0.5 | 0.5 | 0.4 | 0.0 | 0.1 | 0.2 | 0.0 | 0.0 | 0.0 | 0.0 | 0.0 | 0.5 | 0.1 | 0.0 | 0.2 | ||
| 1992 | 0.0 | 0.0 | 0.3 | 0.0 | 0.1 | 0.0 | 0.7 | 0.1 | 0.1 | 0.0 | 0.0 | 0.0 | 0.0 | 0.1 | 0.3 | 0.0 | 0.1 | ||
| 1991 | 0.0 | 0.0 | 0.0 | 0.0 | 0.0 | 0.0 | 0.0 | 0.1 | 0.0 | 0.0 | 0.0 | 0.0 | 0.0 | 0.0 | 0.0 | 0.0 | 0.0 | ||
| 1990 | 0.0 | 0.0 | 0.0 | 0.0 | 0.0 | 0.1 | 0.0 | 0.0 | 0.0 | 0.0 | 0.0 | 0.0 | 0.0 | 0.0 | 0.0 | 0.0 | 0.0 | ||
| 1989 | 0.0 | 0.0 | 0.0 | 0.0 | 0.0 | 0.1 | 0.0 | 0.1 | 0.0 | 0.0 | 0.0 | 0.0 | 0.0 | 0.0 | 0.0 | 0.0 | 0.0 | ||
| 1988 | 0.0 | 0.0 | 0.0 | 0.1 | 0.0 | 0.0 | 0.0 | 0.0 | 0.0 | 0.0 | 0.0 | 0.0 | 0.0 | 0.0 | 0.0 | 0.0 | 0.0 | ||
| 1987 | 0.0 | 0.0 | 0.0 | 0.0 | 0.0 | 0.1 | 0.0 | 0.1 | 0.0 | 0.0 | 0.0 | 0.0 | 0.0 | 0.0 | 0.1 | 0.0 | 0.0 | ||
| 1986 | 0.0 | 0.1 | 0.0 | 0.0 | 0.0 | 0.2 | 0.0 | 0.6 | 0.0 | 0.0 | 0.0 | 0.0 | 0.0 | 0.0 | 0.3 | 0.0 | 0.1 | ||
| 1985 | 0.0 | 0.0 | 0.0 | 0.0 | 0.2 | 0.6 | 0.5 | 1.0 | 0.0 | 0.0 | 0.0 | 0.0 | 0.0 | 0.1 | 0.6 | 0.0 | 0.2 | ||
| 1984 | 0.0 | 0.0 | 0.0 | 0.5 | 0.0 | 0.8 | 0.0 | 0.8 | 0.0 | 0.0 | 0.0 | 0.0 | 0.0 | 0.3 | 0.5 | 0.0 | 0.2 | ||
| 1983 | 0.0 | 0.6 | 0.2 | 1.8 | 0.2 | 1.9 | 0.0 | 1.5 | 0.0 | - | 0.0 | 0.0 | 0.2 | 1.0 | 1.4 | 0.0 | 0.8 | ||
| 1982 | - | 0.1 | - | 0.0 | 0.0 | 0.4 | - | 0.9 | - | 0.0 | - | 0.0 | 0.0 | 0.0 | 0.6 | 0.0 | 0.2 | ||
Reporting rates
Reporting rate is the proportion of all surveys in which the species was present.
Reporting rate by year
This chart shows the reporting rate of Latham’s Snipe each year between 1982 and 2017. 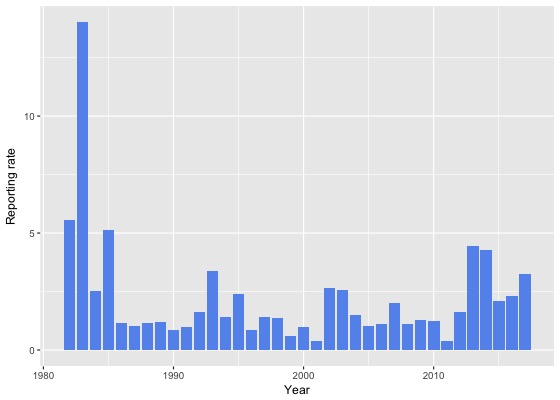
Reporting rate by month
This chart shows the reporting rate by month of Latham’s Snipe. The blue lines show the reporting rate for the twelve months to June 2017 and the bars show the average reporting rate for the period 1982 to 2017. 
Reporting rate by season
This chart shows the seasonal reporting rate of Latham’s Snipe. The blue lines show the seasonal reporting rate for the twelve months to June 2017 and the bars show the average seasonal reporting rate for the period 1982 to 2017. 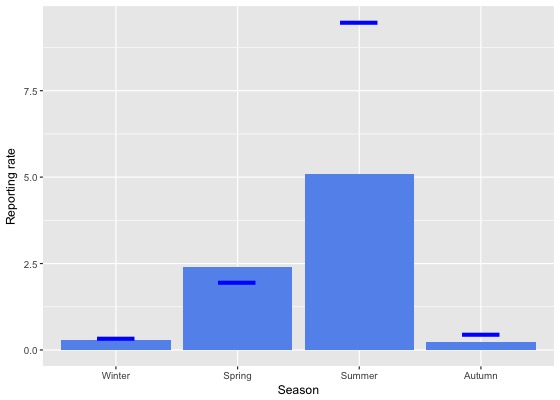
Reporting rate data
| Month | Season | ||||||||||||||||||
|---|---|---|---|---|---|---|---|---|---|---|---|---|---|---|---|---|---|---|---|
| Period | Jul | Aug | Sep | Oct | Nov | Dec | Jan | Feb | Mar | Apr | May | Jun | Winter | Spring | Summer | Autumn | All | ||
| All years | |||||||||||||||||||
| All | 0.0 | 0.9 | 1.4 | 2.3 | 3.5 | 4.1 | 6.3 | 4.8 | 0.6 | 0.1 | 0.0 | 0.0 | 0.3 | 2.4 | 5.1 | 0.2 | 2.1 | ||
| Previous years | |||||||||||||||||||
| All previous years | 0.0 | 0.9 | 1.5 | 2.5 | 3.5 | 3.8 | 5.5 | 3.5 | 0.4 | 0.1 | 0.0 | 0.0 | 0.3 | 2.4 | 4.3 | 0.2 | 1.9 | ||
| Previous 30 years | 0.0 | 0.8 | 1.5 | 2.4 | 3.5 | 3.6 | 5.5 | 3.4 | 0.4 | 0.1 | 0.0 | 0.0 | 0.3 | 2.4 | 4.2 | 0.2 | 1.9 | ||
| Previous 20 years | 0.1 | 0.7 | 1.6 | 2.4 | 4.0 | 3.9 | 5.9 | 3.3 | 0.4 | 0.0 | 0.0 | 0.0 | 0.2 | 2.5 | 4.5 | 0.2 | 2.0 | ||
| 10 year groups | |||||||||||||||||||
| [2007,2017) | 0.1 | 0.8 | 1.9 | 2.6 | 5.1 | 4.6 | 6.0 | 3.6 | 0.5 | 0.0 | 0.0 | 0.0 | 0.3 | 3.0 | 4.9 | 0.2 | 2.3 | ||
| [1997,2007) | 0.0 | 0.4 | 1.1 | 1.5 | 1.8 | 2.6 | 5.6 | 2.4 | 0.3 | 0.0 | 0.0 | 0.0 | 0.1 | 1.5 | 3.4 | 0.1 | 1.3 | ||
| [1987,1997) | 0.0 | 1.1 | 1.0 | 2.6 | 1.8 | 2.0 | 2.9 | 3.9 | 0.6 | 0.2 | 0.0 | 0.0 | 0.4 | 1.8 | 2.9 | 0.3 | 1.4 | ||
| 5 year groups | |||||||||||||||||||
| [2012,2017) | 0.1 | 0.9 | 2.0 | 3.0 | 5.8 | 6.2 | 6.8 | 4.3 | 0.6 | 0.1 | 0.0 | 0.0 | 0.3 | 3.4 | 5.9 | 0.3 | 2.7 | ||
| [2007,2012) | 0.2 | 0.5 | 1.5 | 2.0 | 3.1 | 1.3 | 2.9 | 0.8 | 0.2 | 0.0 | 0.1 | 0.0 | 0.2 | 2.1 | 1.7 | 0.1 | 1.2 | ||
| [2002,2007) | 0.0 | 0.6 | 1.3 | 1.7 | 2.1 | 3.6 | 9.3 | 2.7 | 0.3 | 0.0 | 0.0 | 0.0 | 0.2 | 1.7 | 5.0 | 0.1 | 1.8 | ||
| [1997,2002) | 0.0 | 0.2 | 0.8 | 1.3 | 1.5 | 1.4 | 1.6 | 2.0 | 0.2 | 0.0 | 0.0 | 0.0 | 0.1 | 1.2 | 1.6 | 0.1 | 0.8 | ||
| [1992,1997) | 0.0 | 1.2 | 2.3 | 3.8 | 3.0 | 1.2 | 5.4 | 5.4 | 0.2 | 0.2 | 0.0 | 0.0 | 0.4 | 3.1 | 4.0 | 0.2 | 1.9 | ||
| [1987,1992) | 0.0 | 1.0 | 0.4 | 2.0 | 1.2 | 2.3 | 1.5 | 3.3 | 0.8 | 0.3 | 0.0 | 0.0 | 0.4 | 1.2 | 2.4 | 0.4 | 1.1 | ||
| Year | |||||||||||||||||||
| 2017 | 0.0 | 1.0 | 0.8 | 1.4 | 3.8 | 6.6 | 10.6 | 10.8 | 1.2 | 0.0 | 0.0 | 0.0 | 0.3 | 2.0 | 9.5 | 0.4 | 3.2 | ||
| 2016 | 0.0 | 0.7 | 2.0 | 3.7 | 4.8 | 5.9 | 4.7 | 3.9 | 0.6 | 0.0 | 0.0 | 0.0 | 0.3 | 3.5 | 4.7 | 0.2 | 2.3 | ||
| 2015 | 0.0 | 0.4 | 2.2 | 3.1 | 6.4 | 5.2 | 3.0 | 2.4 | 0.8 | 0.0 | 0.0 | 0.0 | 0.1 | 3.8 | 3.5 | 0.3 | 2.1 | ||
| 2014 | 0.6 | 2.1 | 2.9 | 2.7 | 4.4 | 8.1 | 13.4 | 7.0 | 1.2 | 0.0 | 0.0 | 0.0 | 0.8 | 3.1 | 10.5 | 0.5 | 4.3 | ||
| 2013 | 0.0 | 0.9 | 1.7 | 3.3 | 9.5 | 9.3 | 13.1 | 6.2 | 0.2 | 0.2 | 0.0 | 0.0 | 0.3 | 4.5 | 9.9 | 0.2 | 4.5 | ||
| 2012 | 0.0 | 1.2 | 1.5 | 1.4 | 3.8 | 2.7 | 3.5 | 3.9 | 0.0 | 0.3 | 0.0 | 0.0 | 0.4 | 2.0 | 3.3 | 0.1 | 1.6 | ||
| 2011 | 0.0 | 0.8 | 0.4 | 0.4 | 0.6 | 0.0 | 1.5 | 0.5 | 0.3 | 0.0 | 0.4 | 0.0 | 0.2 | 0.4 | 0.7 | 0.2 | 0.4 | ||
| 2010 | 0.0 | 0.0 | 3.7 | 0.8 | 2.9 | 2.2 | 2.9 | 0.0 | 0.0 | 0.0 | 0.0 | 0.0 | 0.0 | 2.1 | 2.1 | 0.0 | 1.2 | ||
| 2009 | 0.0 | 2.1 | 1.1 | 2.0 | 3.6 | 0.5 | 4.0 | 1.7 | 0.0 | 0.0 | 0.0 | 0.0 | 0.4 | 2.1 | 2.0 | 0.0 | 1.3 | ||
| 2008 | 0.7 | 0.0 | 1.5 | 2.2 | 2.0 | 0.5 | 4.8 | 0.0 | 0.0 | 0.0 | 0.0 | 0.0 | 0.2 | 2.0 | 1.5 | 0.0 | 1.1 | ||
| 2007 | 0.0 | 0.0 | 0.4 | 4.8 | 6.8 | 3.0 | 3.1 | 1.7 | 0.4 | 0.0 | 0.0 | 0.0 | 0.0 | 3.9 | 2.8 | 0.2 | 2.0 | ||
| 2006 | 0.0 | 0.0 | 0.4 | 0.8 | 0.6 | 0.6 | 6.2 | 5.2 | 0.9 | 0.0 | 0.0 | 0.0 | 0.0 | 0.6 | 3.9 | 0.5 | 1.1 | ||
| 2005 | 0.0 | 1.9 | 0.7 | 0.6 | 1.4 | 0.4 | 9.2 | 2.2 | 0.0 | 0.0 | 0.0 | 0.0 | 0.4 | 0.8 | 3.3 | 0.0 | 1.0 | ||
| 2004 | 0.0 | 0.0 | 2.4 | 4.1 | 0.6 | 1.8 | 6.7 | 3.0 | 0.0 | 0.0 | 0.0 | 0.0 | 0.0 | 2.4 | 3.7 | 0.0 | 1.5 | ||
| 2003 | 0.0 | 1.4 | 2.1 | 4.1 | 6.0 | 6.8 | 7.4 | 0.5 | 0.4 | 0.0 | 0.0 | 0.0 | 0.5 | 4.0 | 4.9 | 0.2 | 2.6 | ||
| 2002 | 0.0 | 0.0 | 1.0 | 0.4 | 1.0 | 6.5 | 17.0 | 3.3 | 0.0 | 0.0 | 0.0 | 0.0 | 0.0 | 0.8 | 8.3 | 0.0 | 2.6 | ||
| 2001 | 0.0 | 0.0 | 0.3 | 0.8 | 0.6 | 0.7 | 1.0 | 1.0 | 0.0 | 0.0 | 0.0 | 0.0 | 0.0 | 0.5 | 0.9 | 0.0 | 0.4 | ||
| 2000 | 0.0 | 0.0 | 0.9 | 2.6 | 2.3 | 0.7 | 1.7 | 1.9 | 0.4 | 0.0 | 0.0 | 0.0 | 0.0 | 2.0 | 1.3 | 0.2 | 1.0 | ||
| 1999 | 0.0 | 1.0 | 0.6 | 0.0 | 1.3 | 1.9 | 0.7 | 2.1 | 0.0 | 0.0 | 0.0 | 0.0 | 0.3 | 0.6 | 1.6 | 0.0 | 0.6 | ||
| 1998 | 0.0 | 0.0 | 3.3 | 1.1 | 0.9 | 3.8 | 2.9 | 0.0 | 0.0 | 0.0 | 0.0 | 0.0 | 0.0 | 1.8 | 2.6 | 0.0 | 1.4 | ||
| 1997 | 0.0 | 0.0 | 0.0 | 1.3 | 2.6 | 1.9 | 3.9 | 7.0 | 2.5 | 0.0 | 0.0 | 0.0 | 0.0 | 1.3 | 3.8 | 0.5 | 1.4 | ||
| 1996 | 0.0 | 0.0 | 2.7 | 0.9 | 1.9 | 0.0 | 2.9 | 1.2 | 0.0 | 0.0 | 0.0 | 0.0 | 0.0 | 1.7 | 1.4 | 0.0 | 0.9 | ||
| 1995 | 0.0 | 2.3 | 1.0 | 4.9 | 5.5 | 3.4 | 5.3 | 4.8 | 0.0 | 0.0 | 0.0 | 0.0 | 0.9 | 4.0 | 4.6 | 0.0 | 2.4 | ||
| 1994 | 0.0 | 1.3 | 0.0 | 1.2 | 0.7 | 0.0 | 7.4 | 10.3 | 0.0 | 0.0 | 0.0 | 0.0 | 0.5 | 0.7 | 6.4 | 0.0 | 1.4 | ||
| 1993 | 0.0 | 1.3 | 8.1 | 12.0 | 7.6 | 0.0 | 4.1 | 9.4 | 0.0 | 0.0 | 0.0 | 0.0 | 0.5 | 9.4 | 3.9 | 0.0 | 3.4 | ||
| 1992 | 0.0 | 0.0 | 1.2 | 1.1 | 1.4 | 1.6 | 8.6 | 4.9 | 1.4 | 1.7 | 0.0 | 0.0 | 0.0 | 1.2 | 4.9 | 1.0 | 1.6 | ||
| 1991 | 0.0 | 1.1 | 0.0 | 1.9 | 1.0 | 4.1 | 0.0 | 2.0 | 1.6 | 0.0 | 0.0 | 0.0 | 0.4 | 1.0 | 2.2 | 0.5 | 1.0 | ||
| 1990 | 0.0 | 0.0 | 0.0 | 1.0 | 1.9 | 4.2 | 1.4 | 1.4 | 2.3 | 0.0 | 0.0 | 0.0 | 0.0 | 1.0 | 2.3 | 0.8 | 0.9 | ||
| 1989 | 0.0 | 2.2 | 0.0 | 1.2 | 1.5 | 2.6 | 0.5 | 4.1 | 0.6 | 1.0 | 0.0 | 0.0 | 0.8 | 0.9 | 2.5 | 0.6 | 1.2 | ||
| 1988 | 0.0 | 0.7 | 1.7 | 3.9 | 0.3 | 1.5 | 2.5 | 3.4 | 0.0 | 0.0 | 0.0 | 0.0 | 0.3 | 1.9 | 2.5 | 0.0 | 1.2 | ||
| 1987 | 0.0 | 0.0 | 0.0 | 1.2 | 1.5 | 1.4 | 2.1 | 3.3 | 1.0 | 0.0 | 0.0 | 0.0 | 0.0 | 1.0 | 2.3 | 0.3 | 1.0 | ||
| 1986 | 0.0 | 5.3 | 0.0 | 0.0 | 0.0 | 2.9 | 0.0 | 5.6 | 0.0 | 0.0 | 0.0 | 0.0 | 2.0 | 0.0 | 3.2 | 0.0 | 1.1 | ||
| 1985 | 0.0 | 0.0 | 1.9 | 4.7 | 7.0 | 8.3 | 37.5 | 23.5 | 0.0 | 0.0 | 0.0 | 0.0 | 0.0 | 4.6 | 14.1 | 0.0 | 5.1 | ||
| 1984 | 0.0 | 0.0 | 0.0 | 16.7 | 0.0 | 8.3 | 0.0 | 9.1 | 0.0 | 0.0 | 0.0 | 0.0 | 0.0 | 9.5 | 5.4 | 0.0 | 2.5 | ||
| 1983 | 0.0 | 16.7 | 20.0 | 23.1 | 11.1 | 30.8 | 0.0 | 27.3 | 0.0 | - | 0.0 | 0.0 | 6.9 | 18.5 | 23.3 | 0.0 | 14.0 | ||
| 1982 | - | 9.1 | - | 0.0 | 0.0 | 14.3 | - | 9.1 | - | 0.0 | - | 0.0 | 4.0 | 0.0 | 12.0 | 0.0 | 5.6 | ||
Breeding data
Breeding records by month
Number of breeding records by breeding code and month, 2017 and all years| Breeding code | Jul | Aug | Sep | Oct | Nov | Dec | Jan | Feb | Mar | Apr | May | Jun |
|---|---|---|---|---|---|---|---|---|---|---|---|---|
| 2017 | ||||||||||||
| Breeding (BLA code) | 0 | 0 | 0 | 0 | 0 | 0 | 0 | 0 | 0 | 0 | 0 | 0 |
| Carrying Food | 0 | 0 | 0 | 0 | 0 | 0 | 0 | 0 | 0 | 0 | 0 | 0 |
| Copulating | 0 | 0 | 0 | 0 | 0 | 0 | 0 | 0 | 0 | 0 | 0 | 0 |
| Display | 0 | 0 | 0 | 0 | 0 | 0 | 0 | 0 | 0 | 0 | 0 | 0 |
| Dependent young | 0 | 0 | 0 | 0 | 0 | 0 | 0 | 0 | 0 | 0 | 0 | 0 |
| Faecal sac | 0 | 0 | 0 | 0 | 0 | 0 | 0 | 0 | 0 | 0 | 0 | 0 |
| Inspecting hollow | 0 | 0 | 0 | 0 | 0 | 0 | 0 | 0 | 0 | 0 | 0 | 0 |
| Nest building | 0 | 0 | 0 | 0 | 0 | 0 | 0 | 0 | 0 | 0 | 0 | 0 |
| Nest with eggs | 0 | 0 | 0 | 0 | 0 | 0 | 0 | 0 | 0 | 0 | 0 | 0 |
| Nest with young | 0 | 0 | 0 | 0 | 0 | 0 | 0 | 0 | 0 | 0 | 0 | 0 |
| On/leaving nest | 0 | 0 | 0 | 0 | 0 | 0 | 0 | 0 | 0 | 0 | 0 | 0 |
| All years | ||||||||||||
| Breeding (BLA code) | 0 | 0 | 0 | 0 | 0 | 0 | 0 | 0 | 0 | 0 | 0 | 0 |
| Carrying Food | 0 | 0 | 0 | 0 | 0 | 0 | 0 | 0 | 0 | 0 | 0 | 0 |
| Copulating | 0 | 0 | 0 | 0 | 0 | 0 | 0 | 0 | 0 | 0 | 0 | 0 |
| Display | 0 | 0 | 0 | 0 | 0 | 0 | 0 | 0 | 0 | 0 | 0 | 0 |
| Dependent young | 0 | 0 | 0 | 0 | 0 | 0 | 0 | 0 | 0 | 0 | 0 | 0 |
| Faecal sac | 0 | 0 | 0 | 0 | 0 | 0 | 0 | 0 | 0 | 0 | 0 | 0 |
| Inspecting hollow | 0 | 0 | 0 | 0 | 0 | 0 | 0 | 0 | 0 | 0 | 0 | 0 |
| Nest building | 0 | 0 | 0 | 0 | 0 | 0 | 0 | 0 | 0 | 0 | 0 | 0 |
| Nest with eggs | 0 | 0 | 0 | 0 | 0 | 0 | 0 | 0 | 0 | 0 | 0 | 0 |
| Nest with young | 0 | 0 | 0 | 0 | 0 | 0 | 0 | 0 | 0 | 0 | 0 | 0 |
| On/leaving nest | 0 | 0 | 0 | 0 | 0 | 0 | 0 | 0 | 0 | 0 | 0 | 0 |
Breeding records by year
Average number of breeding records per period by breeding code| Period | Breeding (BLA code) | Carrying Food | Copulating | Display | Dependent young | Faecal sac | Inspecting hollow | Nest building | Nest with eggs | Nest with young | On/leaving nest |
|---|---|---|---|---|---|---|---|---|---|---|---|
| All years | |||||||||||
| All | 0.0 | 0.0 | 0.0 | 0.0 | 0.0 | 0.0 | 0.0 | 0.0 | 0.0 | 0.0 | 0.0 |
| Previous years | |||||||||||
| All previous years | 0.0 | 0.0 | 0.0 | 0.0 | 0.0 | 0.0 | 0.0 | 0.0 | 0.0 | 0.0 | 0.0 |
| Previous 30 years | 0.0 | 0.0 | 0.0 | 0.0 | 0.0 | 0.0 | 0.0 | 0.0 | 0.0 | 0.0 | 0.0 |
| Previous 20 years | 0.0 | 0.0 | 0.0 | 0.0 | 0.0 | 0.0 | 0.0 | 0.0 | 0.0 | 0.0 | 0.0 |
| 10 year groups | |||||||||||
| [2007,2017) | 0.0 | 0.0 | 0.0 | 0.0 | 0.0 | 0.0 | 0.0 | 0.0 | 0.0 | 0.0 | 0.0 |
| [1997,2007) | 0.0 | 0.0 | 0.0 | 0.0 | 0.0 | 0.0 | 0.0 | 0.0 | 0.0 | 0.0 | 0.0 |
| [1987,1997) | 0.0 | 0.0 | 0.0 | 0.0 | 0.0 | 0.0 | 0.0 | 0.0 | 0.0 | 0.0 | 0.0 |
| 5 year groups | |||||||||||
| [2012,2017) | 0.0 | 0.0 | 0.0 | 0.0 | 0.0 | 0.0 | 0.0 | 0.0 | 0.0 | 0.0 | 0.0 |
| [2007,2012) | 0.0 | 0.0 | 0.0 | 0.0 | 0.0 | 0.0 | 0.0 | 0.0 | 0.0 | 0.0 | 0.0 |
| [2002,2007) | 0.0 | 0.0 | 0.0 | 0.0 | 0.0 | 0.0 | 0.0 | 0.0 | 0.0 | 0.0 | 0.0 |
| [1997,2002) | 0.0 | 0.0 | 0.0 | 0.0 | 0.0 | 0.0 | 0.0 | 0.0 | 0.0 | 0.0 | 0.0 |
| [1992,1997) | 0.0 | 0.0 | 0.0 | 0.0 | 0.0 | 0.0 | 0.0 | 0.0 | 0.0 | 0.0 | 0.0 |
| [1987,1992) | 0.0 | 0.0 | 0.0 | 0.0 | 0.0 | 0.0 | 0.0 | 0.0 | 0.0 | 0.0 | 0.0 |
| Year | |||||||||||
| 2017 | 0.0 | 0.0 | 0.0 | 0.0 | 0.0 | 0.0 | 0.0 | 0.0 | 0.0 | 0.0 | 0.0 |
| 2016 | 0.0 | 0.0 | 0.0 | 0.0 | 0.0 | 0.0 | 0.0 | 0.0 | 0.0 | 0.0 | 0.0 |
| 2015 | 0.0 | 0.0 | 0.0 | 0.0 | 0.0 | 0.0 | 0.0 | 0.0 | 0.0 | 0.0 | 0.0 |
| 2014 | 0.0 | 0.0 | 0.0 | 0.0 | 0.0 | 0.0 | 0.0 | 0.0 | 0.0 | 0.0 | 0.0 |
| 2013 | 0.0 | 0.0 | 0.0 | 0.0 | 0.0 | 0.0 | 0.0 | 0.0 | 0.0 | 0.0 | 0.0 |
| 2012 | 0.0 | 0.0 | 0.0 | 0.0 | 0.0 | 0.0 | 0.0 | 0.0 | 0.0 | 0.0 | 0.0 |
| 2011 | 0.0 | 0.0 | 0.0 | 0.0 | 0.0 | 0.0 | 0.0 | 0.0 | 0.0 | 0.0 | 0.0 |
| 2010 | 0.0 | 0.0 | 0.0 | 0.0 | 0.0 | 0.0 | 0.0 | 0.0 | 0.0 | 0.0 | 0.0 |
| 2009 | 0.0 | 0.0 | 0.0 | 0.0 | 0.0 | 0.0 | 0.0 | 0.0 | 0.0 | 0.0 | 0.0 |
| 2008 | 0.0 | 0.0 | 0.0 | 0.0 | 0.0 | 0.0 | 0.0 | 0.0 | 0.0 | 0.0 | 0.0 |
| 2007 | 0.0 | 0.0 | 0.0 | 0.0 | 0.0 | 0.0 | 0.0 | 0.0 | 0.0 | 0.0 | 0.0 |
| 2006 | 0.0 | 0.0 | 0.0 | 0.0 | 0.0 | 0.0 | 0.0 | 0.0 | 0.0 | 0.0 | 0.0 |
| 2005 | 0.0 | 0.0 | 0.0 | 0.0 | 0.0 | 0.0 | 0.0 | 0.0 | 0.0 | 0.0 | 0.0 |
| 2004 | 0.0 | 0.0 | 0.0 | 0.0 | 0.0 | 0.0 | 0.0 | 0.0 | 0.0 | 0.0 | 0.0 |
| 2003 | 0.0 | 0.0 | 0.0 | 0.0 | 0.0 | 0.0 | 0.0 | 0.0 | 0.0 | 0.0 | 0.0 |
| 2002 | 0.0 | 0.0 | 0.0 | 0.0 | 0.0 | 0.0 | 0.0 | 0.0 | 0.0 | 0.0 | 0.0 |
| 2001 | 0.0 | 0.0 | 0.0 | 0.0 | 0.0 | 0.0 | 0.0 | 0.0 | 0.0 | 0.0 | 0.0 |
| 2000 | 0.0 | 0.0 | 0.0 | 0.0 | 0.0 | 0.0 | 0.0 | 0.0 | 0.0 | 0.0 | 0.0 |
| 1999 | 0.0 | 0.0 | 0.0 | 0.0 | 0.0 | 0.0 | 0.0 | 0.0 | 0.0 | 0.0 | 0.0 |
| 1998 | 0.0 | 0.0 | 0.0 | 0.0 | 0.0 | 0.0 | 0.0 | 0.0 | 0.0 | 0.0 | 0.0 |
| 1997 | 0.0 | 0.0 | 0.0 | 0.0 | 0.0 | 0.0 | 0.0 | 0.0 | 0.0 | 0.0 | 0.0 |
| 1996 | 0.0 | 0.0 | 0.0 | 0.0 | 0.0 | 0.0 | 0.0 | 0.0 | 0.0 | 0.0 | 0.0 |
| 1995 | 0.0 | 0.0 | 0.0 | 0.0 | 0.0 | 0.0 | 0.0 | 0.0 | 0.0 | 0.0 | 0.0 |
| 1994 | 0.0 | 0.0 | 0.0 | 0.0 | 0.0 | 0.0 | 0.0 | 0.0 | 0.0 | 0.0 | 0.0 |
| 1993 | 0.0 | 0.0 | 0.0 | 0.0 | 0.0 | 0.0 | 0.0 | 0.0 | 0.0 | 0.0 | 0.0 |
| 1992 | 0.0 | 0.0 | 0.0 | 0.0 | 0.0 | 0.0 | 0.0 | 0.0 | 0.0 | 0.0 | 0.0 |
| 1991 | 0.0 | 0.0 | 0.0 | 0.0 | 0.0 | 0.0 | 0.0 | 0.0 | 0.0 | 0.0 | 0.0 |
| 1990 | 0.0 | 0.0 | 0.0 | 0.0 | 0.0 | 0.0 | 0.0 | 0.0 | 0.0 | 0.0 | 0.0 |
| 1989 | 0.0 | 0.0 | 0.0 | 0.0 | 0.0 | 0.0 | 0.0 | 0.0 | 0.0 | 0.0 | 0.0 |
| 1988 | 0.0 | 0.0 | 0.0 | 0.0 | 0.0 | 0.0 | 0.0 | 0.0 | 0.0 | 0.0 | 0.0 |
| 1987 | 0.0 | 0.0 | 0.0 | 0.0 | 0.0 | 0.0 | 0.0 | 0.0 | 0.0 | 0.0 | 0.0 |
| 1986 | 0.0 | 0.0 | 0.0 | 0.0 | 0.0 | 0.0 | 0.0 | 0.0 | 0.0 | 0.0 | 0.0 |
| 1985 | 0.0 | 0.0 | 0.0 | 0.0 | 0.0 | 0.0 | 0.0 | 0.0 | 0.0 | 0.0 | 0.0 |
| 1984 | 0.0 | 0.0 | 0.0 | 0.0 | 0.0 | 0.0 | 0.0 | 0.0 | 0.0 | 0.0 | 0.0 |
| 1983 | 0.0 | 0.0 | 0.0 | 0.0 | 0.0 | 0.0 | 0.0 | 0.0 | 0.0 | 0.0 | 0.0 |
| 1982 | 0.0 | 0.0 | 0.0 | 0.0 | 0.0 | 0.0 | 0.0 | 0.0 | 0.0 | 0.0 | 0.0 |
Distribution map
Distribution - 2017
This map shows the observed distribution of the Latham’s Snipe for 2017.
The red circles are the grid cells where Latham’s Snipe have been reported.
The transparency of the red circles indicate how many surveys sheets were submitted for that grid cell; the darker the red the more reliable the data. Of the 315 grid cells with reports, 83 had only one sheet; an example is grid number A11.
The size of the circle represents the reporting rate. The maximum reporting rate for Latham’s Snipe was 30.4% (eg grid number S2) and the minimum was 0.3% (eg grid number L12). 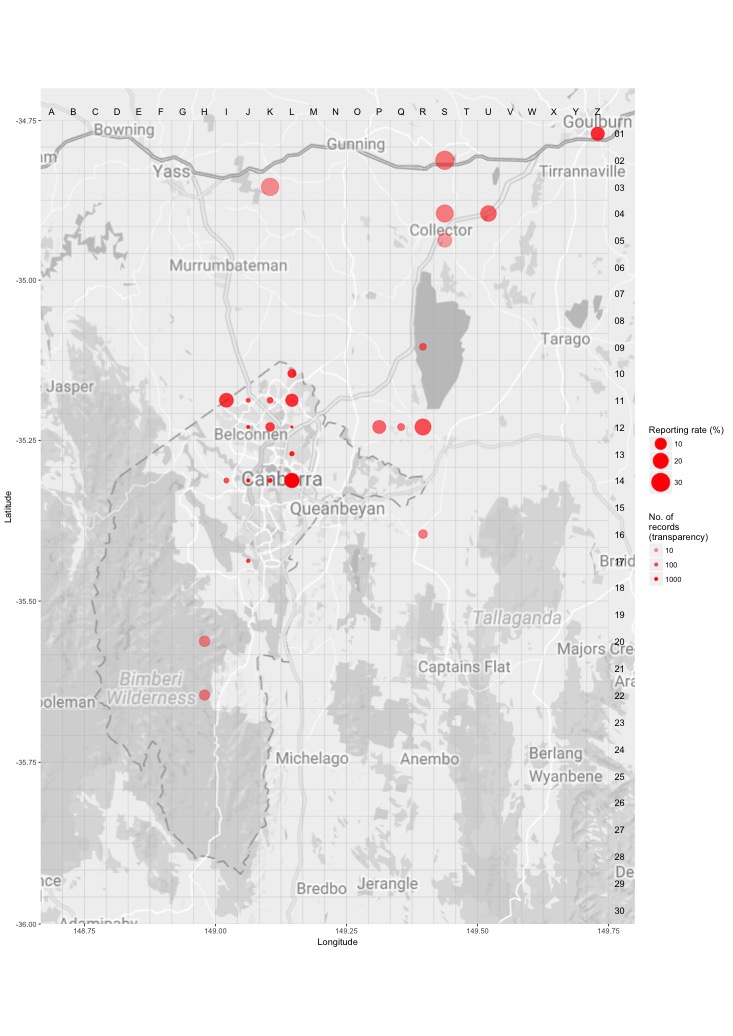
Distribution - all years
This map shows the observed distribution of the Latham’s Snipe for all years.
The red circles are the grid cells where Latham’s Snipe have been reported.
The transparency of the red circles indicate how many surveys sheets were submitted for that grid cell; the darker the red the more reliable the data. Of the 703 grid cells with reports, 55 had only one sheet; an example is grid number A23.
The size of the circle represents the reporting rate. The maximum reporting rate for Latham’s Snipe was 100.0% (eg grid number A23) and the minimum was 0.0% (eg grid number M13). 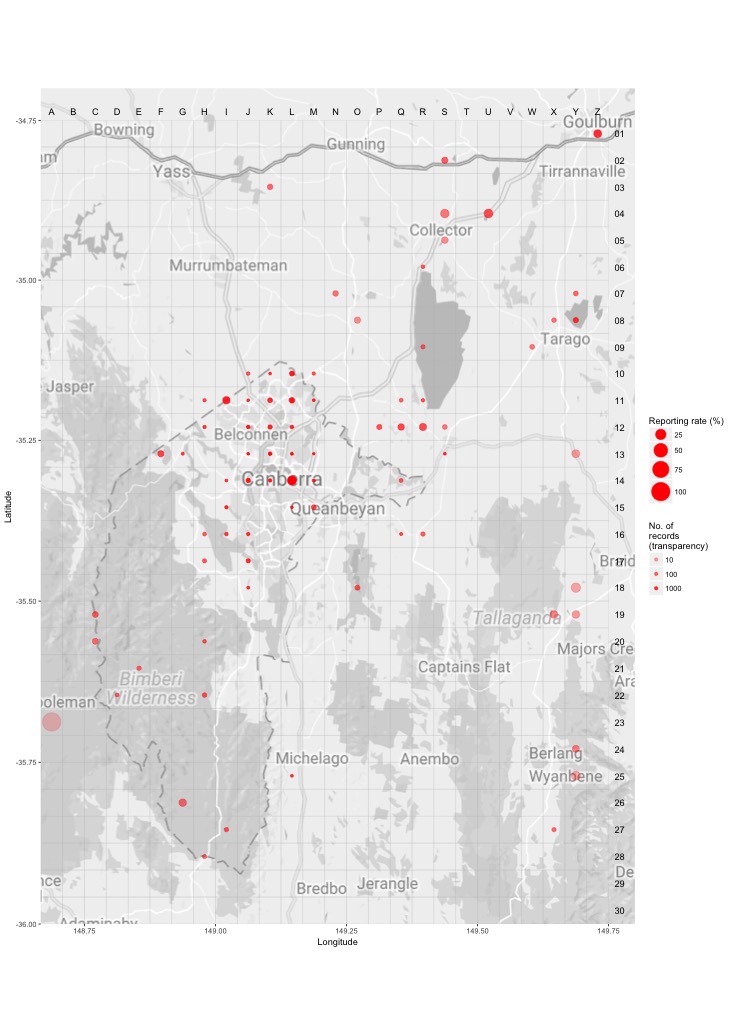
Breeding map
Breeding - 2017
This map shows the breeding distribution of the Latham’s Snipe for 2017.
The red circles are the grid cells where breeding activity for Latham’s Snipe have been reported.
The size of the circle represents the number of reports. 
Breeding - all years
This map shows the breeding distribution of the Latham’s Snipe for all years.
The red circles are the grid cells where breeding activity for Latham’s Snipe have been reported.
The size of the circle represents the number of reports. 